
Products
Manufacturers
Solutions
Published
12 October 2026
Written by Dawn Maindidze
Automated visual inspection normally starts with a simple requirement: determine whether the part in front of the camera looks right.
For this tutorial, we built a complete visual anomaly detection application around the Arduino UNO Q, a USB webcam, and Edge Impulse.
The test object is deliberately simple: a pen with its lid fitted represents the normal condition, while removing the lid triggers an anomaly.
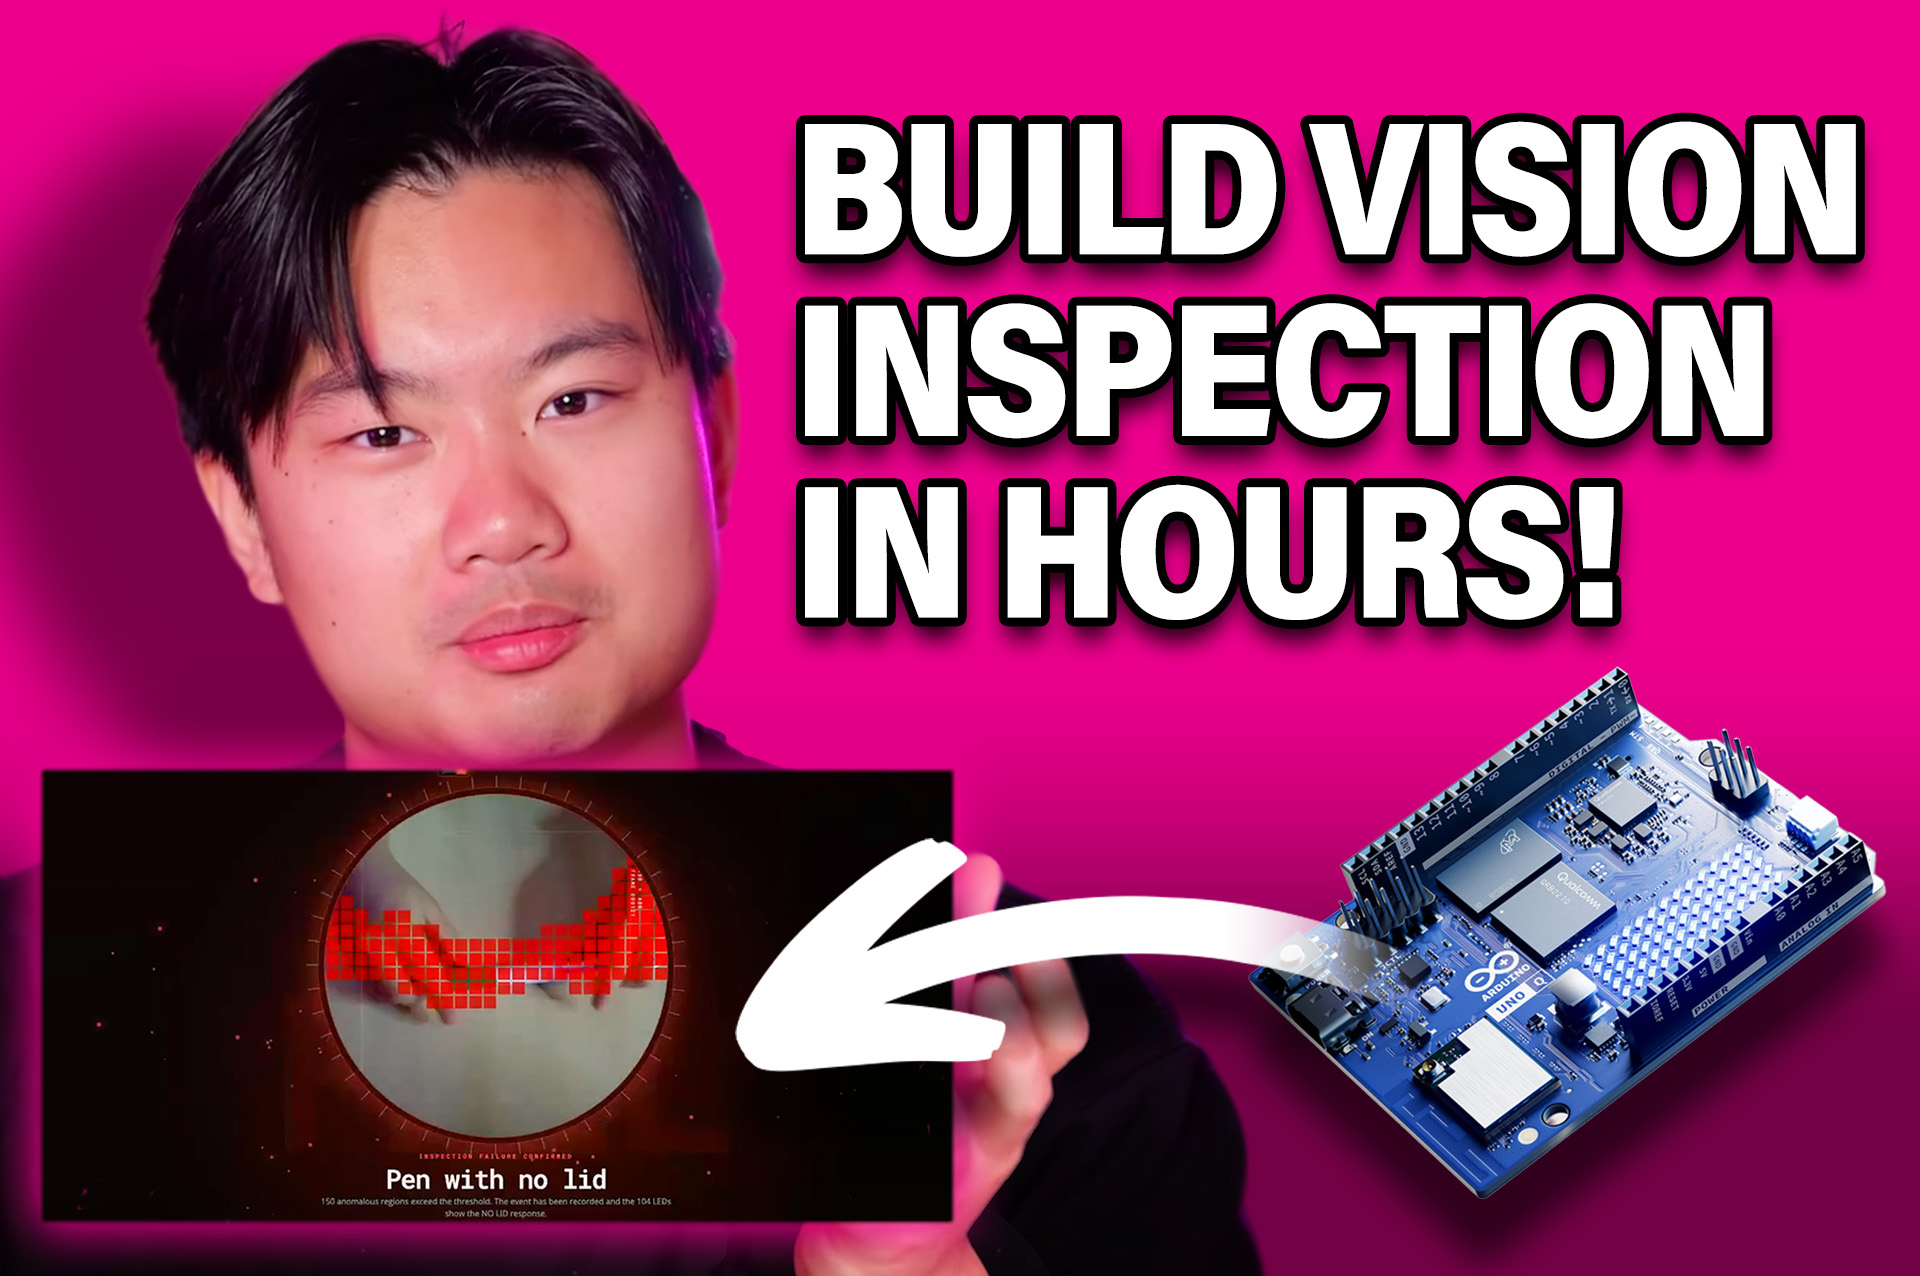
The finished application runs locally, highlights anomalous regions in the camera image, waits for a configurable number of consecutive abnormal frames, changes system state and records inspection events.
The complete prototype took roughly one day to build.
Step 1: Collect the normal dataset
The first stage was creating the training dataset in Edge Impulse.
Around 500 images of the pen were captured across different positions, surfaces and viewing conditions. The important requirement was that the pen remained in its normal state with the lid fitted.
FOMO-AD visual anomaly detection can be trained using normal samples only. During inference, the model compares incoming image regions against the distribution it learned from that normal dataset.
This is useful for inspection tasks where examples of every possible fault are difficult or expensive to collect.
Images containing the missing lid were therefore placed in the test dataset rather than being required for training.
Configure the visual anomaly detection model
The images were processed through an Edge Impulse image pipeline and passed into its FOMO-AD Visual Anomaly Detection block.
The project used RGB images because colour formed part of the visual characteristics of the test object.
PatchCore was selected as the anomaly scoring method.
The model examines regions within an image and assigns anomaly scores according to how far each region differs from the normal training data.
An unexpected object, missing feature or other significant visual change can therefore produce an anomalous result without requiring a separate class for every possible defect.
Step 3: Test and tune the threshold
After training, the model was evaluated using both normal and anomalous test images.
The anomaly threshold controls how different an image must be before the system treats it as faulty.
For this project, the threshold was increased from the initial setting to around 42. The resulting test reported 96.49% accuracy.
You can then check the confusion matrix, anomaly maps, false positives and false negatives before deployment.
Step 4: Connect Edge Impulse to App Lab
Deployment was handled through Arduino App Lab.
App Lab integrates directly with Edge Impulse, allowing compatible models to be selected inside AI Bricks. Arduino documents dedicated Bricks for visual anomaly detection, object detection, image classification, keyword spotting and other inference workloads.
For this project, the trained model was linked to the Visual Anomaly Detection Brick.
This avoided manually building the complete inference pipeline into the application.
Step 5: Build the inspection application
The application combines several elements:
- Live USB camera input
- Local anomaly inference
- An adjustable anomaly threshold
- A minimum number of anomalous image regions
- A consecutive-frame buffer
- LED matrix status indication
- Previous detection logging
- JSON event export
- A browser-based user interface
The frame buffer is particularly important.
A single anomalous frame does not immediately change the inspection state. The condition must persist across several consecutive frames before the application reports a fault.
This reduces sensitivity to momentary camera noise, movement or brief visual interference.
Step 6: Run the system locally
Once launched, the application runs directly on the UNO Q.
With the pen lid fitted, the system remains in its normal state. Remove the lid and anomalous regions appear in the live image.
When enough regions exceed the configured threshold for enough consecutive frames, the application changes state and updates the UNO Q LED matrix.
Replacing the lid causes the same buffered process to return the system to normal.
The prototype achieved roughly three inference cycles per second during the demonstration.
Taking the same workflow into production
A factory implementation would require a more representative dataset, controlled lighting, fixed optics, repeatability testing and proper validation against production tolerances.
The development sequence remains similar.
Capture normal components or machine states. Train the anomaly detector. Test it against representative faults. Set thresholds around the real process. Deploy the model into the inspection application.
App Lab also makes it possible to change the underlying Edge Impulse model without rebuilding the full application architecture, which is useful where one inspection interface needs to support several products or stations.
This prototype is deliberately small, but it demonstrates a complete route from image collection to a working local inspection system using a USB camera, Edge Impulse and Arduino UNO Q.
Comments are closed.
Comments
No comments yet